MLOps · By Ram ·
Why Our MLOps Stack Failed For Large Language Models
Our battle-tested MLOps platform, refined over years of traditional ML, crumbled when we threw LLMs at it. The observability, evaluation, and CI/CD paradigms shifted dramatically, forcing a complete re-evaluation of our tooling and approach.
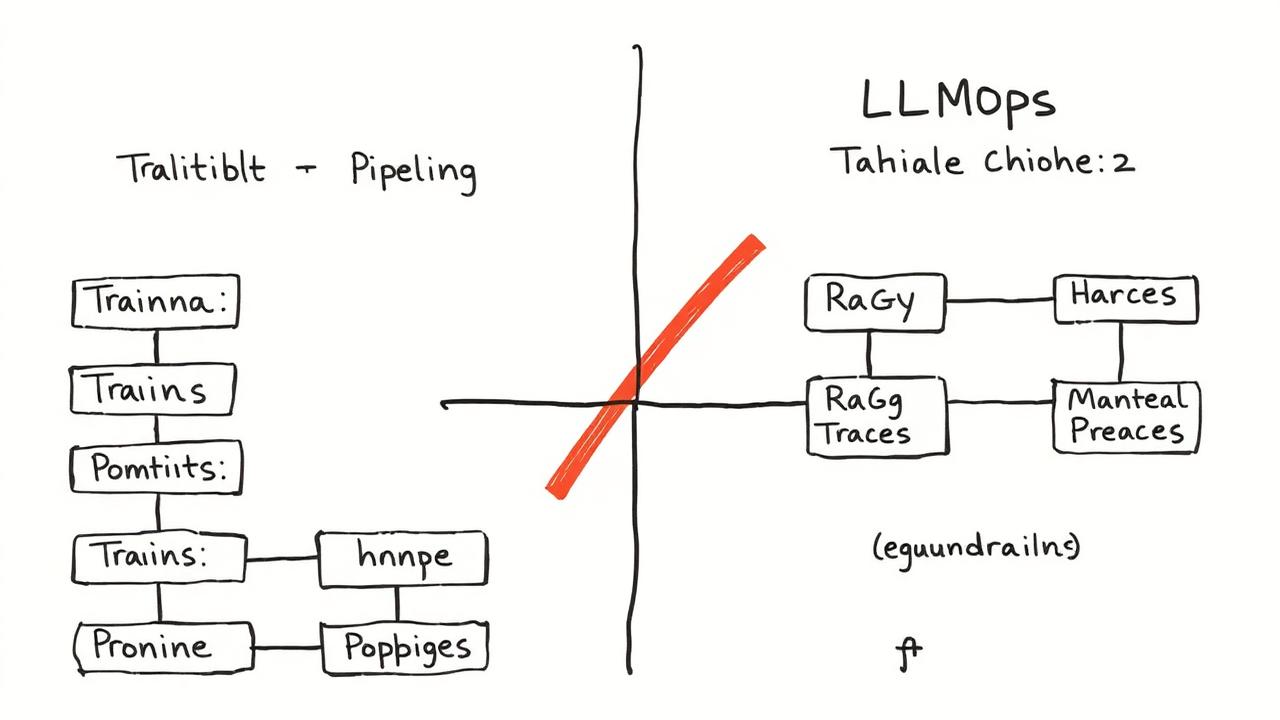
Why Our MLOps Stack Failed For Large Language Models
When we embarked on integrating large language models (LLMs) into our core products at a prior company, I was confident our mature MLOps stack, honed over five years and managing 27 different traditional ML models, would adapt. I was wrong. The fundamental assumptions underpinning our system — particularly around evaluation, versioning, and observability — proved completely inadequate for the nuances of LLM and agent-based workloads.
The Evaluation Black Hole
The biggest shock was how our robust, automated evaluation pipelines, built around metrics like ROC-AUC, precision, and recall, simply evaporated in utility. For our fraud detection models, we'd routinely run hold-out sets of 100,000 transactions, generating precise F1 scores in under 5 minutes. With LLMs generating free-form text, there was no single ground truth. We initially tried human-in-the-loop evaluations, but having 3 annotators score 500 responses per day per model iteration rapidly became an unsustainable bottleneck, costing us over $8,000 weekly for just one project.
Prompt Versioning Was Only Half The Battle
Our existing model registry (MLflow 2.1) was great for tracking code, hyperparameters, and model artifacts (e.g., ONNX files). We quickly extended it to track prompt templates as mere string parameters, but this was superficial. A prompt isn't just a string; it's an input program. Changes to a single token could have wide-ranging, non-obvious effects. We needed a system that could treat prompt versions as atomic, versioned entities, linked directly to the LLM used and the specific data it was evaluated against. Our initial approach led to a nightmare of prompt_v1_final_final_v2.txt files and manual tracking.
Observability Beyond Numeric Drift
For traditional models, we monitored input feature drift, prediction drift, and concept drift. We had dashboards with 30-day moving averages and alerts for any 3-sigma deviations. For LLMs, this shifted dramatically. We needed to monitor prompt tokens, response length, hallucination rates (a new concept entirely!), toxicity scores, and the distribution of generated topics. Our custom dashboards using Prometheus and Grafana simply weren't built for content analysis. We were essentially blind for the first four weeks of our LLM pilot, relying on ad-hoc spot checks.
CI/CD: From Binary Artifacts to Dynamic Flows
Our CI/CD pipelines deployed a new model artifact (e.g., a .pkl or .pt file) via Jenkins, with a blue/green deployment strategy. This worked for static, pre-trained models. LLMs, especially when combined with retrieval-augmented generation (RAG) or agentic patterns, introduced a dynamic dimension. The "model" wasn't just the large pre-trained weight file; it was the combination of the LLM, the RAG index, the prompt orchestrator, and external API calls. Deploying a new "model" often meant updating a vector database, changing an API key, or tweaking a chain of prompts, none of which cleanly fit into our existing artifact-based deployment model.
What We Replaced / What We Built Differently
We ultimately adopted a dedicated LLM platform (initially custom, then leaning heavily on LangChain for orchestration and Arize AI for evaluations) to handle these new challenges. Key changes included:
- Evaluation Harness: Built a flexible, async evaluation framework that plugged into various LLM evaluators (e.g., LlamaIndex's response evaluator, custom regex-based checks, and later, GPT-4 as an evaluator).
- Prompt Registry: Implemented a first-class prompt registry that versioned not just the prompt string, but also metadata like target LLM, associated tools, and evaluation results.
- Semantic Observability: Integrated with a specialized LLM observability tool that automatically parsed traces, identified chain steps, and generated metrics like token counts, latency per step, and semantic similarity scores.
aws s3 cp my_new_prompt.jinja s3://prompt-registry/my-agent/v1.2.3/template.jinja
python register_prompt.py --name my-agent --version 1.2.3 --path s3://prompt-registry/my-agent/v1.2.3/template.jinja
What I'd Do Differently
Looking back, I'd have invested in an external LLM evaluation platform significantly earlier. We spent nearly four months building bespoke evaluation tools that only covered 60% of our needs. The cost of subscribing to a specialized LLM observability and evaluation platform would have been easily offset by the engineering hours saved, especially given our team's 11 engineers were working 50+ hour weeks. Additionally, I would have pushed for a modular agent framework from day one, rather than trying to shoehorn agentic behaviors into our existing batch inference services.
Remaining Challenges
Even with these improvements, truly robust, automated, and trustworthy evaluation for complex, multi-turn LLM agents remains partially unsolved. While we have metrics for individual turns or specific outputs, understanding the emergent behavior and overall goal completion success of an agent over extended interactions is difficult. We're still relying on periodic human reviews and A/B testing in production, which offers a qualitative view but lacks the deterministic rigor of traditional ML evaluation.