MLOps · By Ram ·
What I Learned Building an ML Model to Predict CI/CD Pipeline Failures
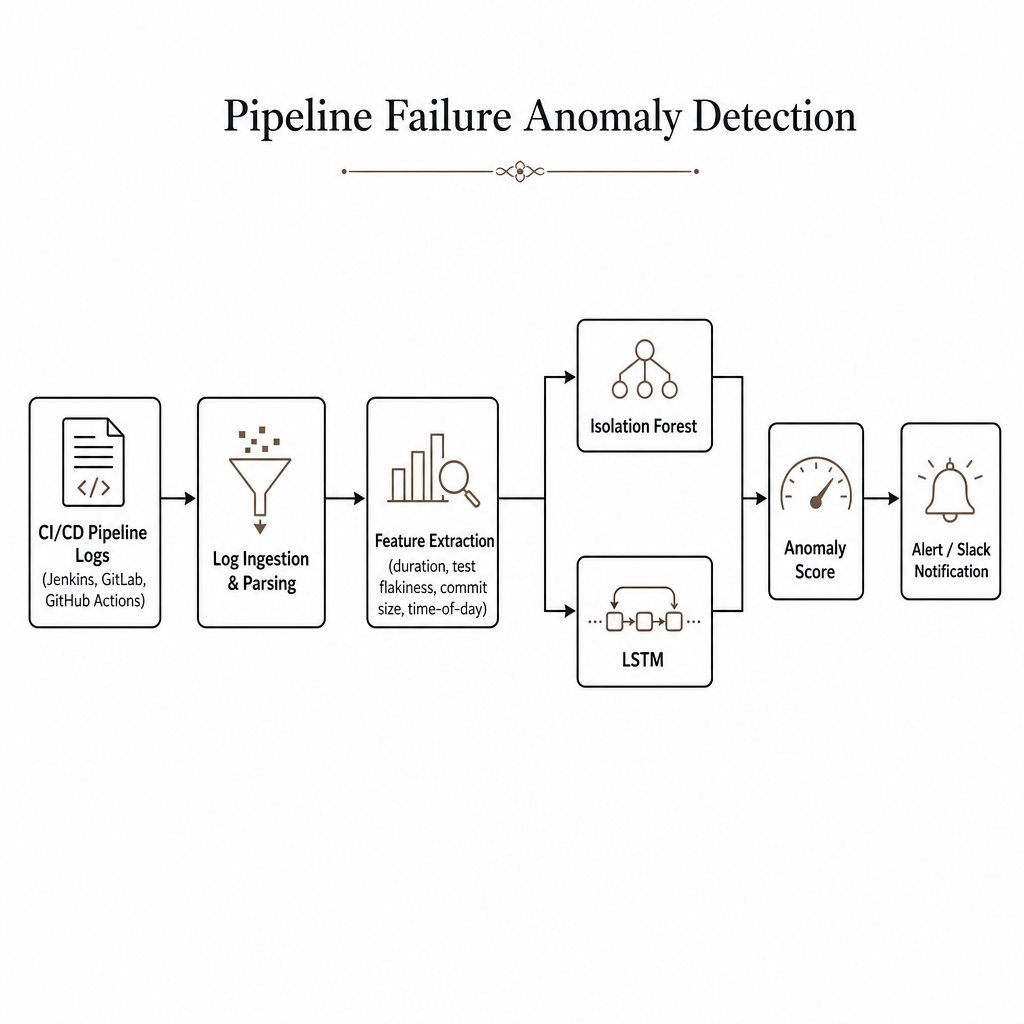
A practitioner's notes on building an Isolation Forest and LSTM-based anomaly detector for CI/CD pipeline failures: which features actually had signal, why class imbalance and label noise dominate the problem, how the two models compared in production, and the honest limitation that's still unsolved.
What I Learned Building an ML Model to Predict CI/CD Pipeline Failures
This piece draws on work I've been doing at an enterprise manufacturing company, building an anomaly detection system over CI/CD pipeline logs. Parts of this are also being written up for academic submission — so I'll be careful to frame the results as ongoing rather than headline numbers.
Why pipeline failure data is messier than people expect
The pitch for ML on CI/CD logs is seductive: pipelines emit structured data, failures are labeled, the cost of a failed deploy is measurable. In practice, the data has three properties that make standard supervised approaches frustrating.
First, severe class imbalance. In a mature pipeline, real failures are rare — well under 5% of runs in our case, and the most interesting failures (silent regressions, flaky integrations that only fail under load) are rarer still. Naive accuracy is meaningless; a model that always predicts "success" looks great on a confusion matrix.
Second, noisy labels. A "failed" pipeline is not a clean target. Many failures are infrastructure flakes — a runner pod evicted, a transient registry timeout, a flaky test that no one has quarantined yet. The label says "failed" but there's no underlying signal to learn. Conversely, some "successful" runs masked real problems that surfaced two deploys later. We hand-relabeled a stratified sample of 800 runs early on and found roughly 18% of the original labels were misleading — either flake-driven failures or success-with-issues.
Third, and the one that bit me hardest: non-stationarity. The distribution of failures drifts every time the pipeline itself changes — new stages added, runners upgraded, a build tool updated. A model trained on Q1 data started degrading visibly by mid-Q2. This isn't a tuning problem; it's a fundamental property of the domain.
Features that worked vs features that didn't
I came in with a list of features that "should" matter. Reality split it in half.
What surprised me by actually carrying signal:
Stage-duration ratios, not raw durations. The total build duration was noisy and trended upward over time as the codebase grew. But the ratio of, say,
test_stage_duration / build_stage_durationwas much more stable and shifted noticeably before failure clusters.Recent test-flakiness rate per test file, computed over a 14-day rolling window. When the flakiness rate of a small cluster of tests spiked, downstream pipeline failures often followed within a day or two — exactly the kind of leading indicator anomaly detection is supposed to find.
Commit churn measured as files-touched × lines-changed, bucketed log-scale. Predictive on the tail; a build with 40+ files changed had a meaningfully different failure profile.
What I expected to work but didn't:
Raw build duration. Too confounded with codebase growth and runner heterogeneity.
Time-of-day / day-of-week. Lots of papers cite this. In our environment it correlated more with who was deploying than with any real failure mechanism, and adding it just let the model overfit team identity.
Commit author features. Tried it; it works in offline metrics, but I removed it. Predicting that a specific engineer's commits fail more often is the kind of "technically accurate" output you do not want surfacing in a Slack alert. The political cost is infinite; the operational benefit is zero.
Isolation Forest vs LSTM
I tested both because they answer different questions. Isolation Forest treats each pipeline run as an independent point in feature space and flags outliers. LSTM treats the sequence of recent runs on a given pipeline as a time series and flags deviations from learned temporal patterns. For more on why pure supervised classifiers struggle here, see [INTERNAL LINK: Why Most "AI for DevOps" Tools Fail in Production].
What we found, roughly:
Isolation Forest was the better deploy-day-one model. It needed no sequence assembly, retrained in seconds on a few months of data, and caught most "this run is structurally weird" cases — wildly unusual stage timings, oddly large artifact sizes, a deploy at an unusual hour combined with other anomalies.
LSTM caught a category Isolation Forest fundamentally couldn't: slow drifts. Pipelines where individual runs all looked fine but the trend over the last ~20 runs was diverging from the long-term baseline. These were the leading indicators of brewing problems — a dependency slowly getting slower, test runtimes creeping up week over week — that no per-run model can see.
The honest comparison: on point-in-time anomaly precision/recall, Isolation Forest was competitive with the LSTM and a tenth of the operational overhead. The LSTM only earned its keep on drift detection. If I were starting again I would not deploy the LSTM until the Isolation Forest baseline was solidly in production, well-tuned, and being ignored by on-call for the right reasons.
For the canonical reference on Isolation Forest, the original paper by Liu, Ting, and Zhou is still the right starting point — [EXTERNAL LINK: "Isolation Forest" (Liu et al., 2008) — official paper].
The threshold problem nobody writes about
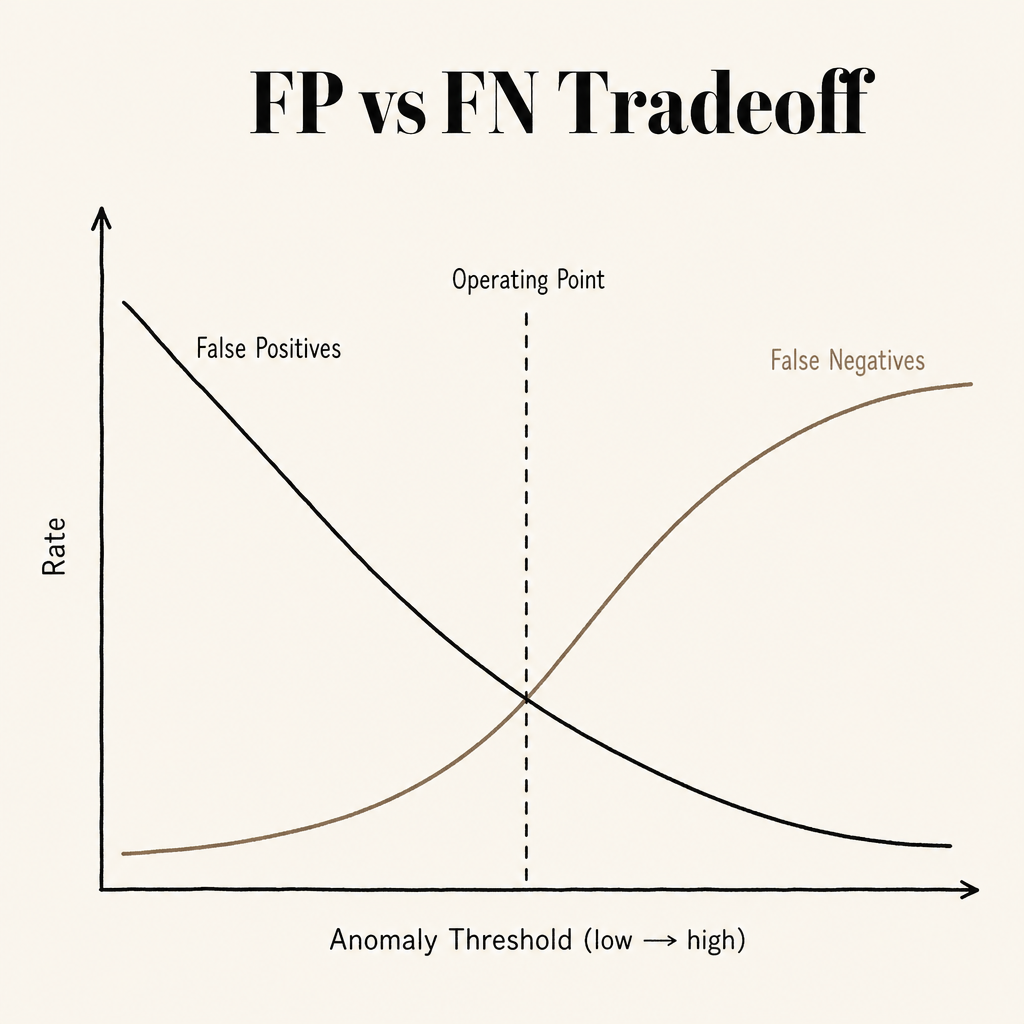
Picking the anomaly score threshold is where the academic framing collides with operational reality. Push the threshold low and you get false positives; on-call ignores the channel within a week. Push it high and you miss exactly the subtle failures you built the system for.
What I settled on — and this is the honest practitioner answer, not the elegant one — is a two-tier output. Anomalies above a high-confidence threshold (roughly the 99th percentile of historical scores) post to the active on-call channel. Anomalies between a lower threshold and the high one go to a low-priority "patterns to review" channel that someone scans during weekly pipeline health review. This split single-handedly killed the alert fatigue conversation. It's also boring and doesn't make for a good conference slide.
One honest limitation
The system is good at flagging "something is statistically off." It is not good at explaining why. Feature importances from Isolation Forest are approximate, and LSTM attention weights are not the explanation people think they are. When an engineer asks "why did this fire?" the best I can currently do is surface the top contributing features and the recent pipeline trajectory — not a causal story. That's the part I'm working on next, and the part that, in my opinion, separates a research toy from a tool engineers actually rely on. For related ideas on capturing institutional knowledge from past incidents, see [INTERNAL LINK: Building an Organizational "Failure Memory" for CI/CD].
— Ram