
← Back to blog

Installations · By Ram ·

Scaling Beyond 800 Targets: Prometheus & Grafana's Breaking Points

We hit some hard limits with Prometheus and Grafana once our monitored targets crossed 800. From cardinality explosions to federation woes, here's what actually broke and how we fixed it.
Scaling Beyond 800 Targets: Prometheus & Grafana's Breaking Points

Scaling Beyond 800 Targets: Prometheus & Grafana's Breaking Points

When I joined the team back in late 2018, our Prometheus and Grafana setup was handling about 150 targets across two data centers beautifully. We were all pretty confident in our monitoring story. Fast forward 18 months and a significant infrastructure expansion, we were approaching 850 targets, and our once-reliable monitoring stack was constantly on fire. We learned some hard lessons about cardinality, federation, and the true cost of easy metrics.

The Cardinality Bomb that Bit Us in Week Three

The first major issue, and the one that landed me on a three-day, sleep-deprived pager rotation, was a cardinality explosion. We deployed a new service mesh (Istio 1.1.7 at the time) that, by default, exposed metrics with an absurd number of labels, including full request URLs and container IDs. Within 72 hours of deploying Istio to our 120-node Kubernetes cluster, our main Prometheus server's resource utilization shot up. Disk I/O was constantly 100%, and RAM usage jumped from 16GB to 60GB on a machine provisioned with 64GB. Scrapes started failing, alerts stopped firing reliably, and our 3-week old Prometheus instance was effectively dead.

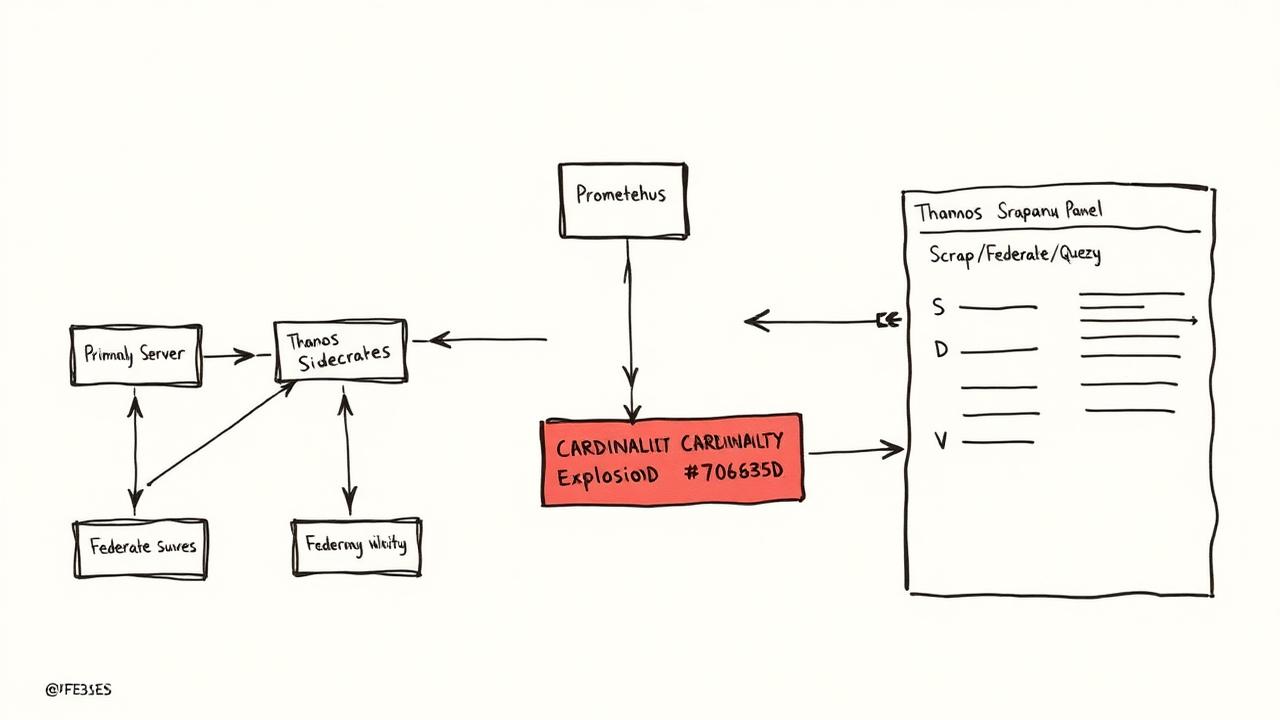
Diagram showing increased scrape targets leading to higher cardinality in Prometheus, resulting in resource exhaustion.

Our Initial Fix: Relabeling and Exclusions

It was clear we couldn't ingest everything. Our immediate action was to implement aggressive relabeling rules in Prometheus to drop high-cardinality labels. We focused on `kubernetes_pod_name`, `container_id`, and `request_path` for certain metrics. For some Istio metrics, we opted to drop them entirely due to their inherent high cardinality with limited operational value at scale.

- job_name: 'kubernetes-pods'
  kubernetes_sd_configs:
    - role: pod
  relabel_configs:
    - source_labels: [__meta_kubernetes_pod_container_name]
      regex: 'istio-proxy'
      action: keep
    - source_labels: [__name__]
      regex: 'istio_requests_total|istio_request_duration_milliseconds'
      action: keep
    - source_labels: [__name__, request_path]
      regex: 'istio_requests_total;/.*/v1/status.*'
      action: drop
    - source_labels: [instance, kubernetes_node_name, container_id]
      regex: '^(.*)


      action: drop

This brought CPU down from 95% to 40% and RAM to 28GB, giving us some breathing room. We also increased our scrape interval for less critical metrics from 15s to 30s for services that didn't require high-frequency updates, shaving another 10% off the load.

Federation: A Solution That Created New Problems

As we continued to scale, monitoring became more distributed. We had 5 clusters across 3 regions, each with its own Prometheus instance. To get a global view in Grafana, we implemented Prometheus federation. We set up a 'global' Prometheus instance that scraped select metrics from the regional Prometheis. This worked initially for dashboards, but querying across vast amounts of federated data in Grafana became painfully slow, often timing out. A single dashboard with 10 panels could take 45-60 seconds to render.

Recording Rules vs. Thanos for Global Queries

We initially tried to tackle slow global queries by creating extensive recording rules on our federated Prometheus. We pre-aggregated common dashboard metrics like sum(rate(http_requests_total[5m])) by (app, namespace). This helped simplify Grafana queries and sped up dashboards, but maintaining these rules became a significant overhead.

Eventually, around the 1100-target mark, we pivoted to Thanos. We deployed Thanos Sidecars alongside each regional Prometheus and a Thanos Query instance acting as a global query API. This dramatically simplified cross-cluster querying. Query latency dropped to 5-10 seconds for the same global dashboards.

On-Call Burnout and Alerting Fatigue

With 800+ targets and many services, our Alertmanager (version 0.15.0) started struggling with message processing, leading to delayed notifications. We also began experiencing significant alert fatigue. I spent two months working with teams to refine alert definitions, focusing on symptoms over causes and establishing clear SLOs. We reduced the total number of firing alerts by 40% and streamlined our notification channels, moving from 12 distinct Slack channels to 3 aggregated ones with clear escalation trees.

What I'd Do Differently

If I were to start over today with the same scaling trajectory, I would have integrated Thanos from day one. The headaches introduced by federation and the subsequent re-architecture to Thanos were significant. I'd also be much more aggressive with default relabeling rules in our base Prometheus deployments, establishing strict cardinality budgets per service.

Lingering Challenges: Long-Term Storage and Ad-Hoc Analytics

Even with Thanos, long-term storage remains a point of cost and complexity. Our object storage bill for Prometheus metrics was consistently growing by 15% quarter-over-quarter. While Thanos handles it efficiently for queries, performing deep, ad-hoc analytical queries on metrics spanning months is still cumbersome and slow.