DevOps · By Ram ·
The Hidden Cost of Observability Tool Sprawl in Enterprise DevOps
<p>I've worked across enterprise environments — financial services, large-scale manufacturing — where the observability stack wasn't <em>designed</em>...
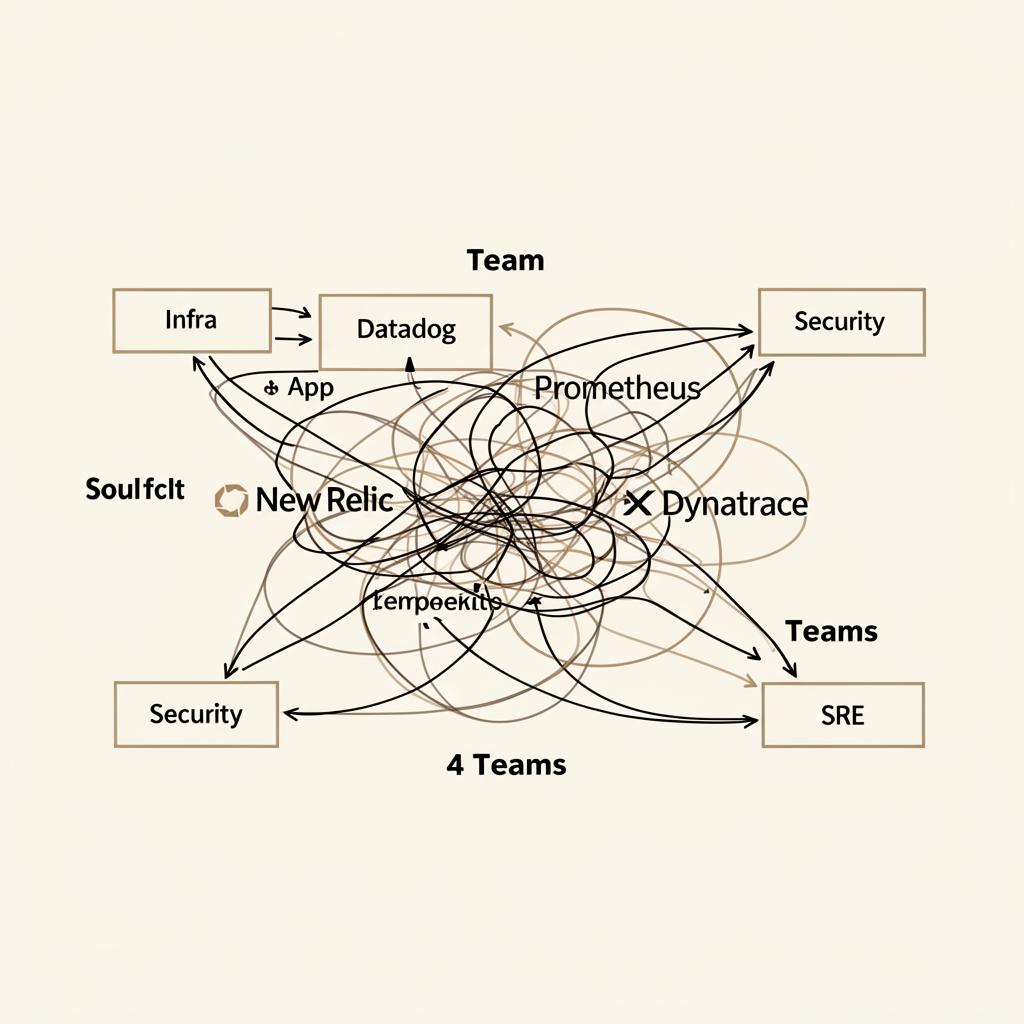
I've worked across enterprise environments — financial services, large-scale manufacturing — where the observability stack wasn't designed so much as it accumulated. By the time anyone tried to map it, the picture looked like this: one tool for infrastructure metrics, another for application logs, a third for APM, a SIEM the security team owned, and a fourth APM that came in through an acquisition. Five tools, four owners, one incident channel.
This is the part nobody puts in a vendor case study: tool sprawl doesn't happen because of bad decisions. It happens because of good ones, made independently, by teams who were each solving a real problem at the time.
How sprawl actually happens
The infra team standardized on Prometheus + Grafana years ago because it was free, on-prem, and the metrics model matched how they thought about hosts. The application team bought Datadog because the developer experience for distributed tracing was better than anything they could self-host. Security stood up Splunk because compliance needed long-retention log search with audit guarantees Loki couldn't provide at the time. Then an acquisition brought a fully-managed New Relic contract with 18 months left on it, and nobody was going to eat that cost to consolidate "someday."
Every one of those decisions was defensible. Stitched together, they're a mess.
[IMAGE: Diagram showing a typical sprawled toolchain — 4-5 overlapping tools feeding different teams]
The real cost isn't the license
Finance sees the line items. What they don't see:
Alert fatigue. Same incident, three pages, slightly different wording, across three tools. On-call learns to mute the noisy one — which is sometimes the one that fires first on the real thing.
Context-switching during incidents. Trace in Datadog, host metric in Grafana, auth log in Splunk, customer impact in a fourth dashboard. Every tab switch is 5–10 seconds of working memory loss.
Inconsistent runbooks. The runbook says "check CPU in Grafana," but the new service emits to Datadog. The runbook is wrong before it's printed.
The incident that made this concrete
A payments service started returning 502s for a small slice of traffic. APM (Datadog) showed elevated upstream latency. Infra metrics (Prometheus) showed nothing wrong with the nodes. The actual cause was a misconfigured egress proxy whose logs only went to Splunk — and Splunk wasn't wired into the incident channel for that service. We spent 47 minutes chasing application code before someone thought to grep the proxy logs. A unified log + metric view would have surfaced the proxy errors in the first query.
That's the cost. Not the license. The 47 minutes.
A consolidation framework that doesn't blow up
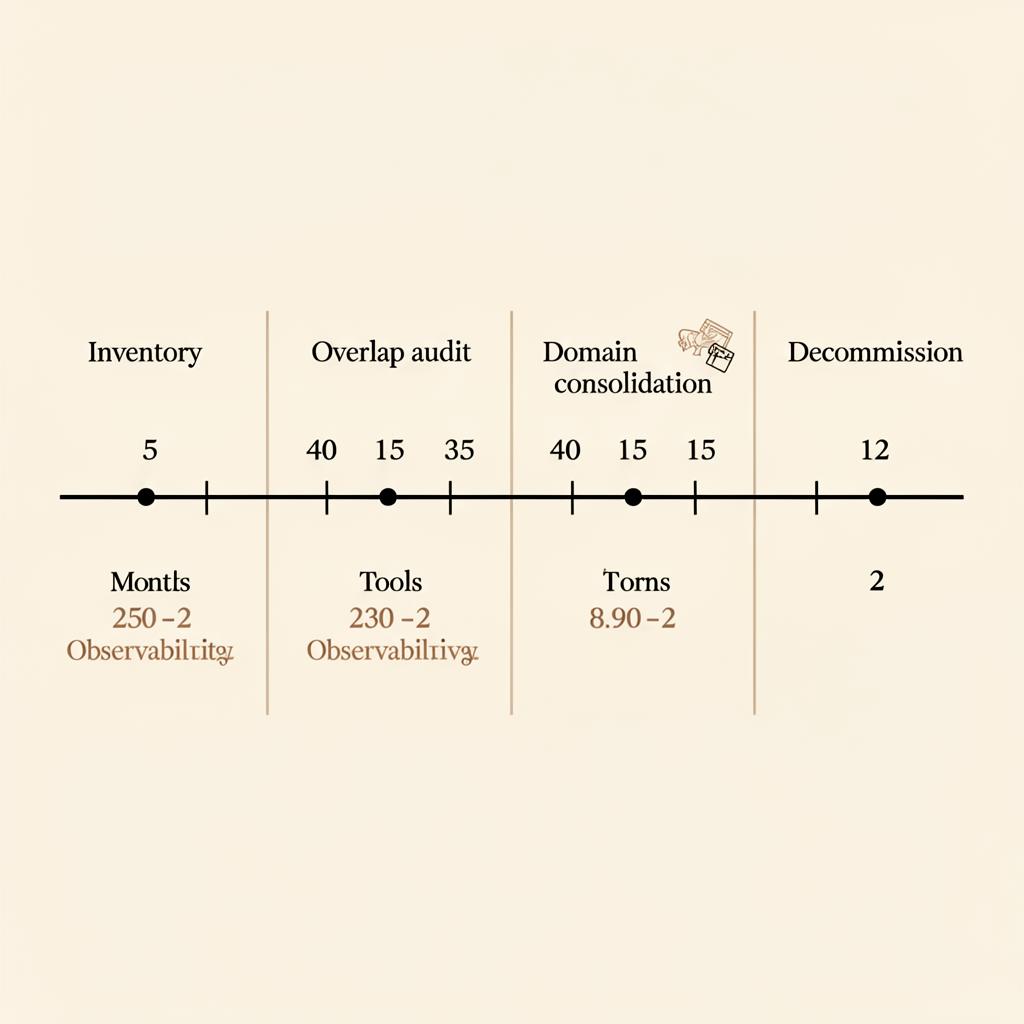
Big-bang replatforming sounds clean and never is. What works better is a multi-quarter, no-regret sequence:
Inventory. Every tool, every owner, every renewal date, every data type it actually receives (not what it could receive — what's flowing today).
Overlap audit. For each signal type (host metrics, app logs, traces, security events) list every tool that holds it. Mark the system of record for each.
Domain consolidation. Pick one tool per signal type. Stop new onboarding to the others. Don't migrate existing data — let it age out.
Decommission on renewal. When a contract comes up, that's your forcing function. Not a sprint goal.
[IMAGE: Simple before/after consolidation roadmap timeline]
What I'd push back on
The conventional advice is "consolidate to one platform." I don't think that's right for most enterprises. A single vendor for metrics + traces + logs at enterprise scale gets eye-watering fast, and the lock-in is real — you can't move tens of TB of historical telemetry casually. Two tools, picked deliberately, beats one platform you grew to resent. The win isn't "one pane of glass." It's "no signal stored in only one place no one's looking at."
Honest limit of what I just described: this framework slows the bleeding. It doesn't stop the next acquisition from arriving with a sixth tool. The org problem is upstream of the tooling problem, and I haven't solved that one.
Related: From Zabbix to Datadog: A Real Migration Playbook and more DevOps posts on DevNfra. For background on the broader telemetry model, the OpenTelemetry documentation is the right starting point.